Product reports
Sidebar → Products → Product Reports.
What this page really is
It is your product list with better filters and a CSV export. Not a performance report.
That is worth saying plainly, because the dashboard implies otherwise: the Analytics page describes this as “best sellers, stock levels, and product performance”, and the page’s own subtitle says “inventory and product performance overview”. Neither is accurate. There is no sales figure, no revenue, no units sold and no stock level anywhere on this page.
The columns are: Product, SKU, Category, Brand, Status.
If you came looking for what sells best, see where to find real numbers below.
The three counts at the top
| Card | What it counts |
|---|---|
| Total Products | Every product matching your filters |
| Active (page) | Active products on the page you are looking at |
| Inactive (page) | The same, for everything not active |
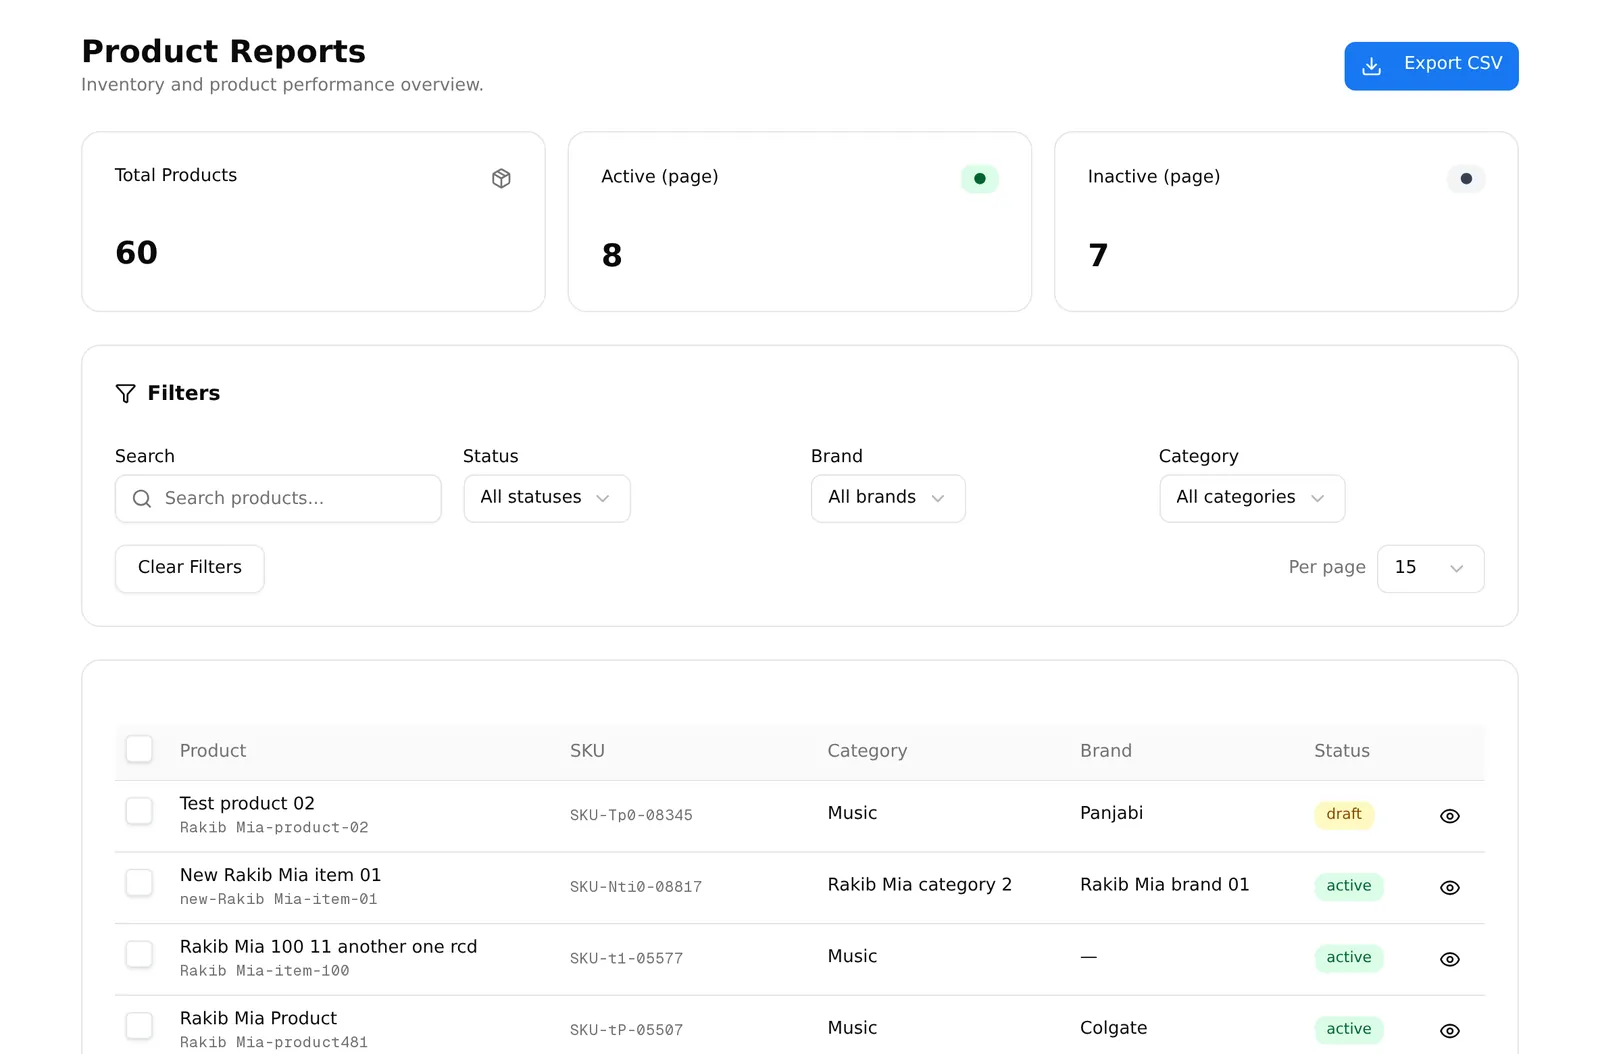
Only the first covers your whole catalogue. The other two say “(page)” for a reason — with 20 rows on screen they will never exceed 20, however many products you have.
Filtering
Search by name, then narrow by:
- Status — All statuses, Active, Inactive, Draft
- Brand — any brand you have created
- Category — any category
Clear Filters resets everything.
Exporting
Export CSV, top right. Tick rows first and the button changes to Export N Selected — selection wins over filters, same as everywhere else in the dashboard.
The file opens in Excel or Google Sheets.
What it is genuinely good for
Auditing your catalogue, which is a real job nobody enjoys:
- Filter to Draft — products you started and never published. Every one is a product customers cannot buy.
- Filter to Inactive — things you stopped selling. Still taking up your plan’s product allowance.
- Filter by brand or category, then export — the fastest way to check a supplier’s range is complete and priced.
- Look for blank SKUs and categories in the export. A product with no category cannot be found on your storefront.
Where the sales numbers actually are
| Question | Where |
|---|---|
| Which products sold, and for how much | Order reports — export and total by product |
| Total sales and average order value | Marketing overview |
| What is running out | Inventory & low stock |
Common problems
“Active and Inactive do not add up to Total Products.” They only count the current page; Total counts everything matching your filters.
“I cannot find best sellers.” Not on this page, and not anywhere in the dashboard yet. Export from Order reports and total by product in a spreadsheet.
“My export has fewer rows than the table shows.” You had rows ticked.